Types of Alternative Data: The Good, the Bad, and the Ugly
Don’t let spaghetti logic ruin a classic spaghetti Western
Takeaways
Not all Alternative Data is created equally.
Understanding and investing in one type of data does not scale to ‘all’ types of alternative data.
Each type of Alternative Data tells a different part of the story.
Technology is the only scalable way to expand the Alternative Data industry.
Although the alternative data industry is several years old now, there is reason to believe that its growth is just beginning to jump-start.
It was crystal clear in the essential Sergio Leone spaghetti western who were The Good, the Bad and the Ugly: Clint Eastwood’s Blondie, Lee Van Cleef’s Angel Eyes and Eli Wallach’s Tuco. But who decided who’s whom, and what were the criteria? Blondie had a sadistic streak a mile wide, Angel Eyes is the only one with the moral compass to never double-cross anyone and Tuco – well, sorry, Eli, but you’re the one who agreed to be in-frame right between those other guys. You’re the male Kate Jackson.
All three main characters were in turn good, bad and ugly both as people and as professional outlaws; it took titles inserted into freeze frames to distinguish them. And so it goes for not only this cinematic classic, but also for alternative data. Is this metaphor a stretch? Maybe, but bear with me a little.
There are many different types of alternative data, and each type requires a level of domain expertise, experience, technology, specialized models and interpretation. Data might want to be free, but the university-educated professionals who ingest, categorize, extract, validate and deliver it don’t. This is why multi-strategy hedge funds and quant funds invest in big-ticket data and technology teams to build out their alternative data strategy.
This is also why we at Facteus go to work every day to prove that technology must play a critical role in democratizing data literacy. It is way too expensive for every user to become an expert at each type of data.
Here are some examples of different data types. All are a little good, a little bad and plenty ugly. They’re defined more by their idiosyncrasies than by their qualities.
Mobile Phone Geolocation Data
The good
You can buy anonymized geo pings from companies on millions of mobile devices around the world. These phone or device IDs are then timestamped with latitude and longitude coordinates as often at almost any time interval you’d find useful.
Location data requires special database overlays that specialize in location information. This data, incidentally, is pretty useless unless it’s combined and overlaid with a point-of-interest ("POI”) data set. For example, if you received the coordinates: 45.49785989601841, -122.81063481179038, this would be meaningless as a row of data. If you overlaid this to a POI database, though, you would see that these coordinates are inside of a Best Buy in Beaverton, Ore., down the street from Facteus HQ. Now this data point provides some value, especially if you pay attention to those last couple decimals and add the time dimension. Did I take something to the Geek Squad shop? Was I wandering around the Apple devices? Was I parked in front of an 83-inch OLED screen for an hour? These are things Best Buy – as well as all the brands it showcases – would want to know. More on that in a moment.
A POI database – a map of polygons that provide context to an enclosed area – can be bought or built in-house by a fund or company.
The bad
The problem with POI databases it that they are extremely expensive to build initially. Imagine someone going through a map and drawing polygons around every Best Buy in the country so that you will know when a mobile phone walks into one. Then you’d have to do the same for every Home Depot, Starbucks, McDonald’s and other chain-store location everywhere.
The other option is to buy one. There are definitely some players out there that are quite good like PlaceIQ, Foursquare and SafeGraph.
Now you’re at the point where you can see geo-ping data and have some context of what’s happening. Still, so what? What does it mean when you see someone walk into a Best Buy? Does it mean they purchased anything? Does a spike in foot traffic in a store in Los Angeles hold any significance for the company as a whole? This is a challenge for the investment analysts at the funds, so it also becomes a challenge for those of us in the business of presenting the data in a way that those on the client side can most easily digest it.
The ugly
Geo-ping data is particularly noisy. When analyzing foot traffic with this data it is important to understand that some of the geo-pings are with the retail employees as well as the customers. A spike then could mean that business is about to boom, but it could just as easily mean the Best Buy is overstaffed. It’s important to develop algorithms to separate this noise out.
Further, the type of geo-ping varies in location accuracy. There are four major types, which each has a varying level of accuracy, as Sensolus demonstrates:
GPS ping
Cell tower ping
Bluetooth ping
Wifi ping
Datasets will always have a mixture of each type of ping and, because people are constantly moving around, it will never be consistent. And even if they were, there’s a limit to how accurate GPS can be. How many times have you made the wrong right turn because there were two possible rights to make within a tenth of a mile and Google Maps thought you understood which one it meant?
“Recalculating route,” it would tell you. Its passive-aggressive tone was entirely your imagination. Probably.
The same accuracy issue pervades this use case. Maybe the person allegedly looking at espresso makers isn’t in the Best Buy at all, but on the line for popcorn at the cinema next door? It might be a difference of only about 150 feet, just enough for the geo-ping sensors to get it all wrong.
Debit & Credit Card Transaction Data
The good
This is data that is anonymized – or, in our case, synthesized – from debit and credit cards used by millions of people across the country.
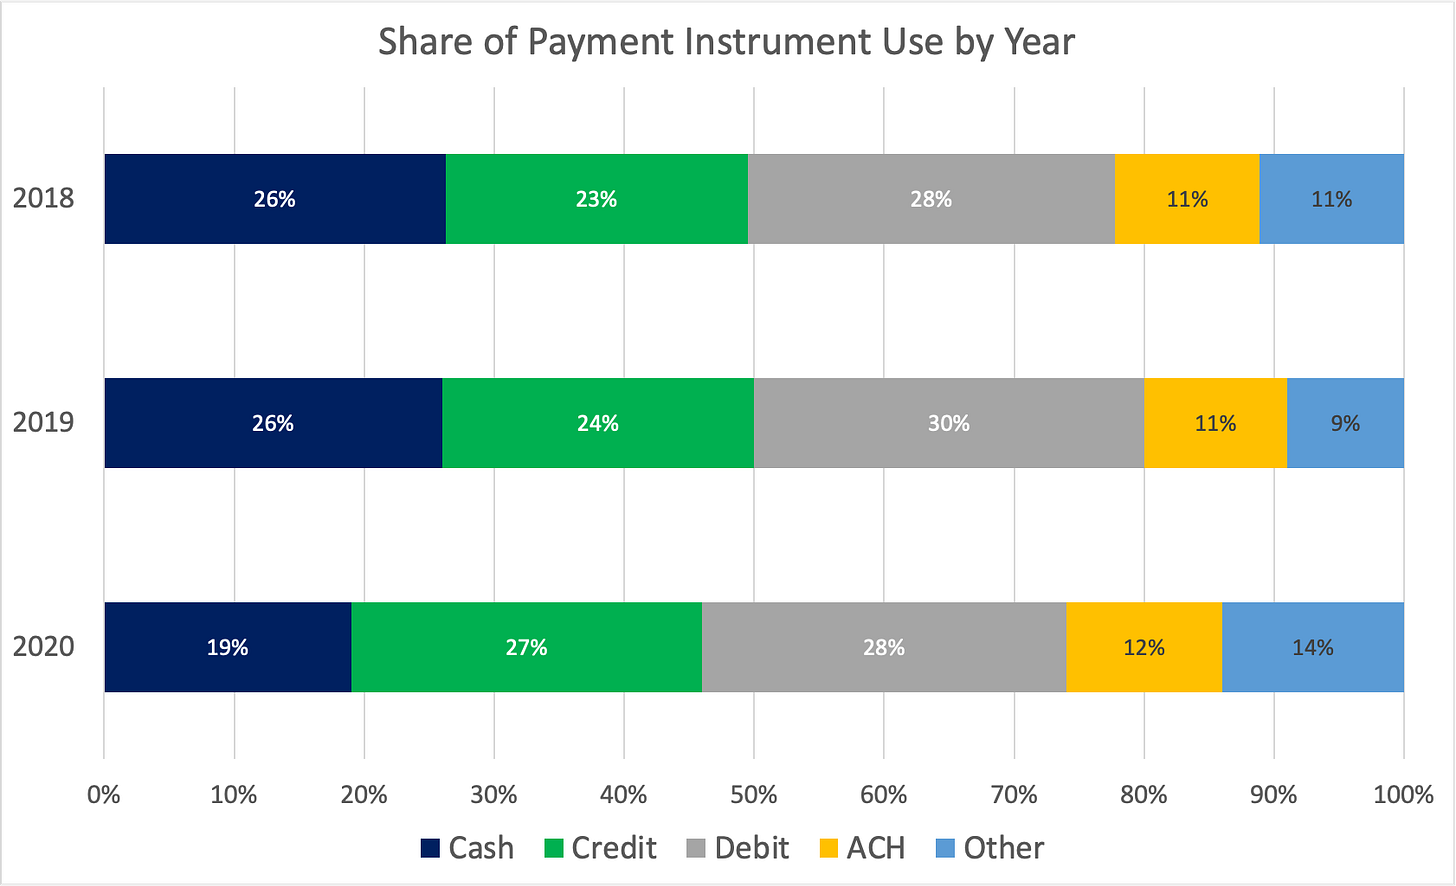
Total card payments exceed $7 trillion per year in the U.S., according to the Federal Reserve. For comparison’s sake, a recent Fed study shows that credit and debit cards combine for 55% of all payments in 2020, compared with 19% for cash.
So this is very, very important data to track.
Pardon me if I see more bad in this type of data. It is, after all, what Facteus specializes in and I know more than is healthy about it.
The bad
Data ingestion leads inevitably to inconsistencies and issues. Depending on where the transaction data comes from there are many issues that a firm must consider when ingesting and using this type of data. When ingesting from such data aggregators as Yodlee, MX or Plaid, there are issue because the data does not come through on weekends and then there are massive updates on Mondays from these providers. Funds’ analysts attempting to model in real time need to make assumptions and distribute the Monday load to the weekend in order to smooth out the dailies.
When ingesting from “Auth” fraud detection systems, the weekend issue is no longer a problem, but a data duplication issue arises instead. These systems record every swipe or every time a point-of-sale sends a signal through the system. It is not a system of record. When you swipe your card three or four times because the register is receiving an error message, this might create three or four records in the Auth system. This requires special “de-duping” models to make the data usable.
Transaction data also has some challenges when contextualizing the data. In order to make sense of spending data you will need to categorize the transactions by store, if not more granularly. Transaction data is accompanied with long text strings that describe where the transaction took place, similar to what you would see on a bank statement. This requires building custom machine learning algorithms to interpret and categorize these text strings to standardize the names so that the data can be queried.
The ugly
All transaction data panels have biases in geographies, income levels, age demographics and so on. This is just a reality because neither the largest banks nor the most ubiquitous payment processing networks offer their data in the alternative data space. They have their business reasons why they stay out, but that also means all the vendors are left using smaller data sets with inherent biases. This takes some additional data science and modeling to panel the data properly and de-bias it so that it can be used for analysis.
Satellite Imagery Data
The good
This data is essentially a bunch of photos with timestamps taken from satellites over a specific geographic region.
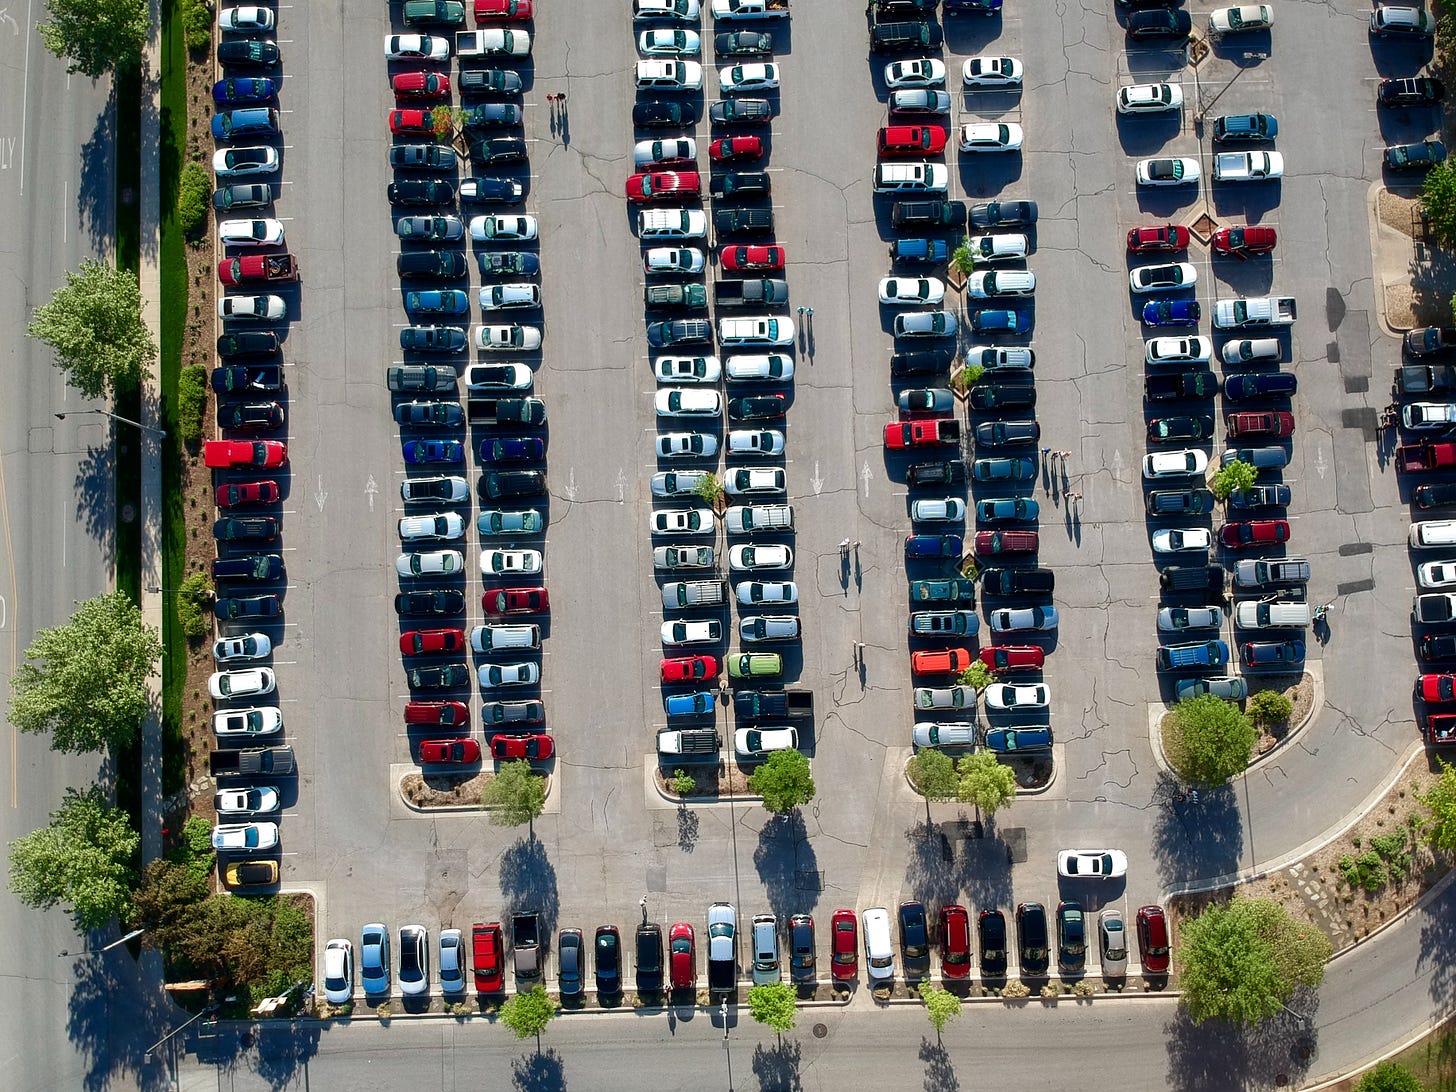
Machine learning models are trained to detect cars in parking lots. This is the typical use case: to see how full parking lots are of malls or specific stores.
The bad
Satellite imagery is inherently complex, requiring a fund firm to invest in an entirely separate system with literally astronomic amounts of data storage. Also, cloudy days and nighttime can be problematic and can create data point voids.
The ugly
As with geo-ping, POI database must be used to contextualize the information, with all the same limitations when it comes to proximity. Just because a car parked at a specific point in a mall parking lot, that doesn’t tell you much. Did the driver indeed park at the closest point to the store they wanted to visit? Did they park randomly because they don’t know the mall layout? Did they park as far away as they could to get more steps in? You really can’t tell which stores are attracting more cars.
The Mosaic
Nobody has all the information. In The Good, the Bad, and the Ugly, Tuco and later Angel Eyes knew the $200,000 in gold was in the Sad Hill Cemetery. Blondie knew it was in the grave of the unknown soldier next to Arch Stanton’s. They had to put both those data sets together before they could uncover the gold.
(Now you see where I was going with this?)
Any one source of alternative data is necessary but not sufficient for actionable insights based on sound analysis. Satellite imagery can tell you what vehicles are in a mall’s parking lot. You can then follow the driver and passengers around the mall and get a sense of the foot traffic. You can then, use transaction data to determine what they bought and how much they spent.
But none of these individually tells you the whole story and is even less helpful in predicting future consumer behavior. That requires having a technology platform that integrates data from all these sources and translates it all into a meaningful whole.
If you can do that, you could be the one riding away with all the loot across a wide, Techniscope landscape.


